New Functionality in GA4
With the Google Analytics 4 (GA4) switch-over looming large over the digital marketing community, it’s never too soon to take a look at some features and capabilities of the latest analytics tracking platform released by Google.
In particular, we will explore three subject areas that we feel are particularly interesting: funnels, elapsed time and pathing analysis. Funnels are very useful for determining where in a purchase or form fill journey that visitors are dropping off. Elapsed time represents an improved calculation of time spent between user actions and pathing allows for great ways to troubleshoot potential issues with the site that need addressing.
Funnels
In the current Universal Analytics (UA) version of Google Analytics, you were limited to making a funnel as part of a goal based on a destination URL you paid for Google Analytics 360 (GA360), you could also create ad hoc funnels based on events. In GA4, this later functionality has been made available to everyone and expanded.
Google explains funnel exploration as such: “Funnel exploration lets you visualize the steps your users take to complete a task and quickly see how well they are succeeding or failing at each step.”
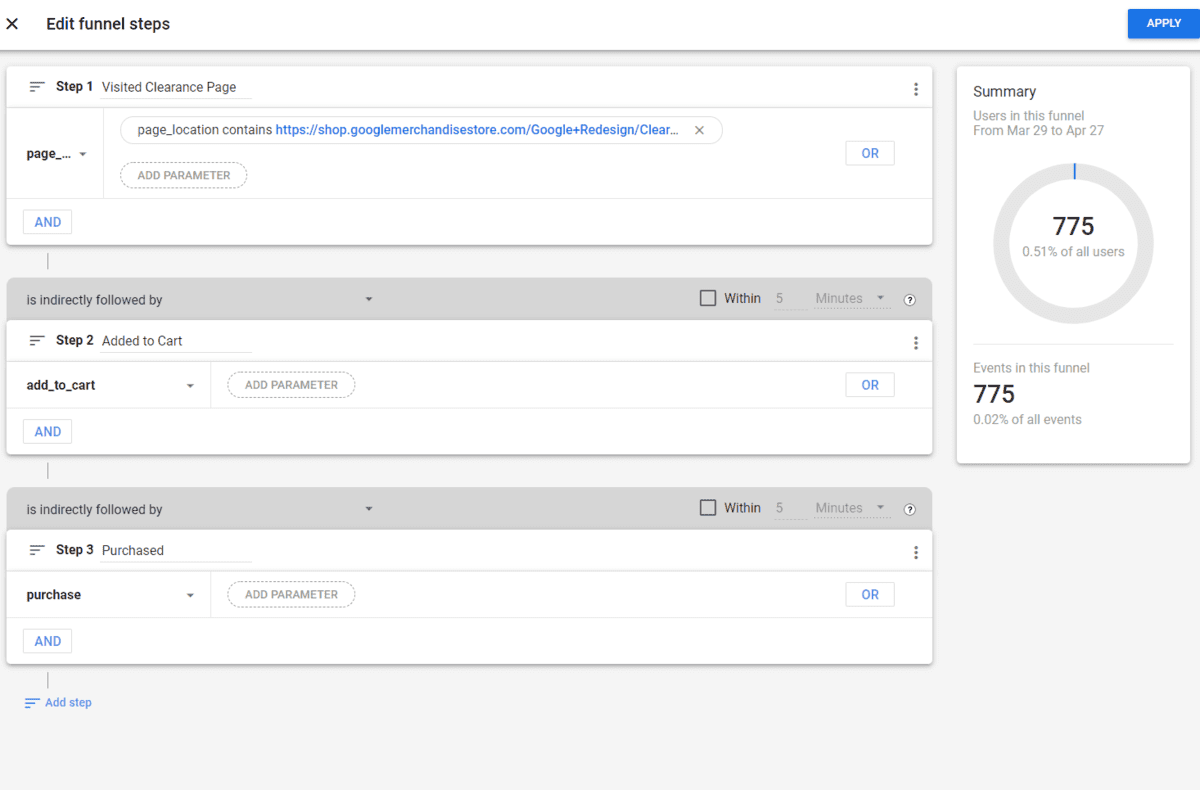
You create these custom funnel reports in the Explore section of GA4 using an exploration report with the technique of “funnel exploration”. Variables available to you include segments, dimensions and metrics. The metrics available at this time are limited to event count, active users or total users. Under the Tab Settings, you set up the steps of your funnel and whether it is open or closed.The following is an example of such a report based on following the use from the clearance page to add a cart and purchase.
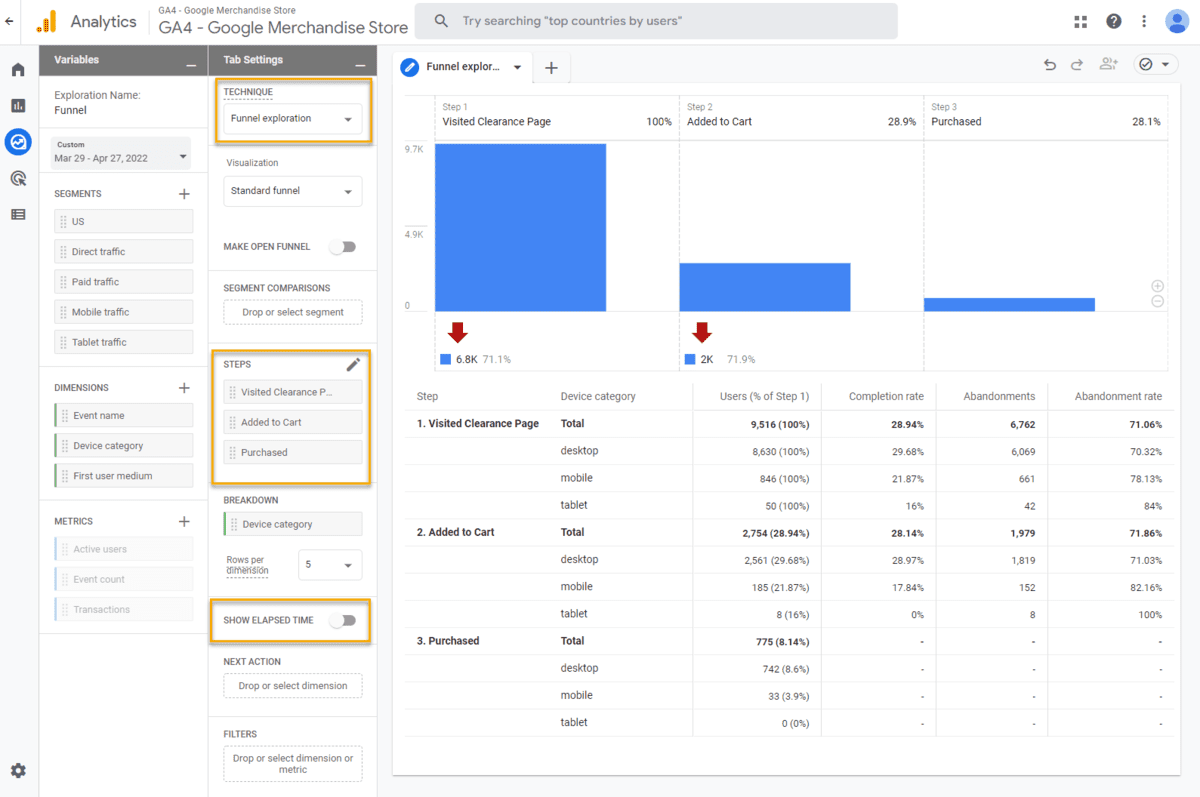
You can add a breakdown based on dimensions such as source, medium, gender, country, device category (shown above), etc. Once you create the basic funnel with the variables you are interested in, the resulting graph and data table allow you to then interact with the displayed metrics allowing you to look at specific segments of data. Right-clicking on one of the data points provides a drop-down menu from which you can create an accompanying report focusing only on that particular segment. A real-world application to this would be setting up a segment of users who ended up abandoning your funnel and then examining what it is about that group that makes them different.
This following image is an example of how the funnel steps are created. There are many different events and dimensions you can correlate this way. With the ability to filter based on parameters you can also tailor it to very specific circumstances.
All of this creates a powerful way to examine where things are going right or wrong. This type of data insight can go a long way to helping you improve the user journey to conversions.
Elapsed Time
Another exciting new feature of GA4 is the way the system tracks time. The past iterations of Google Analytics left a lot to be desired when it came to tracking time with the metrics time on page and session duration. These metrics were derived by comparing the timestamps from when pages were loaded–the difference being the time on page.. When there was no second timestamp, like when the user visited a single page or for the final page of their visit, that time on the site would not be captured (0 seconds). This often led to undercounting the time the visitor spent on the last page of their visit, arguably in many cases the most important. If the user triggered an event on the page, that could introduce a later timestamp so accrue some time, but that was typically inconsistent across all pages.
GA4 has revamped the way it calculates time allowing you to see the elapsed time between any action on the site, not just the time between page views. This is especially useful when looking at how long a user’s journey took between events in any given custom funnel that you create.
Google’s definition of the user_engagement event provides more context:
“Analytics sends the event when a user navigates off the page, which happens when a user closes their tab or window or when they navigate to another page or screen. The event includes the session engagement status and user engagement duration.”
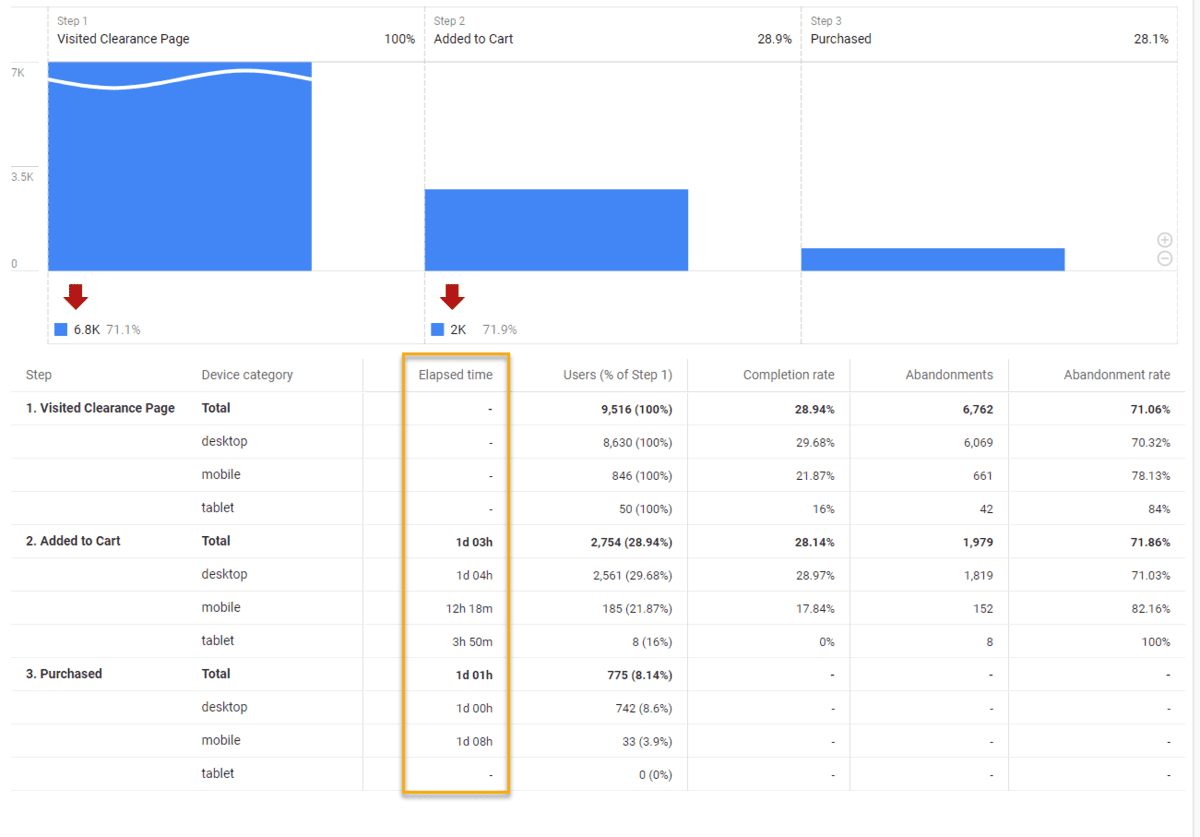
Within the funnel exploration report, there is the ability to take a look at elapsed time between advancements in the funnel. For example, it can give you insight into how long it takes for a purchase to take place on your site. Let’s say you are looking at a funnel for an ecommerce website where it takes, on average, over a day from the time a product is placed in the cart before a purchase is made. This time span provides a great opportunity to take advantage of any marketing automation you may have to potentially send a reminder email to a user that they have an item in their cart and incentivise them to complete the purchase.
Pathing
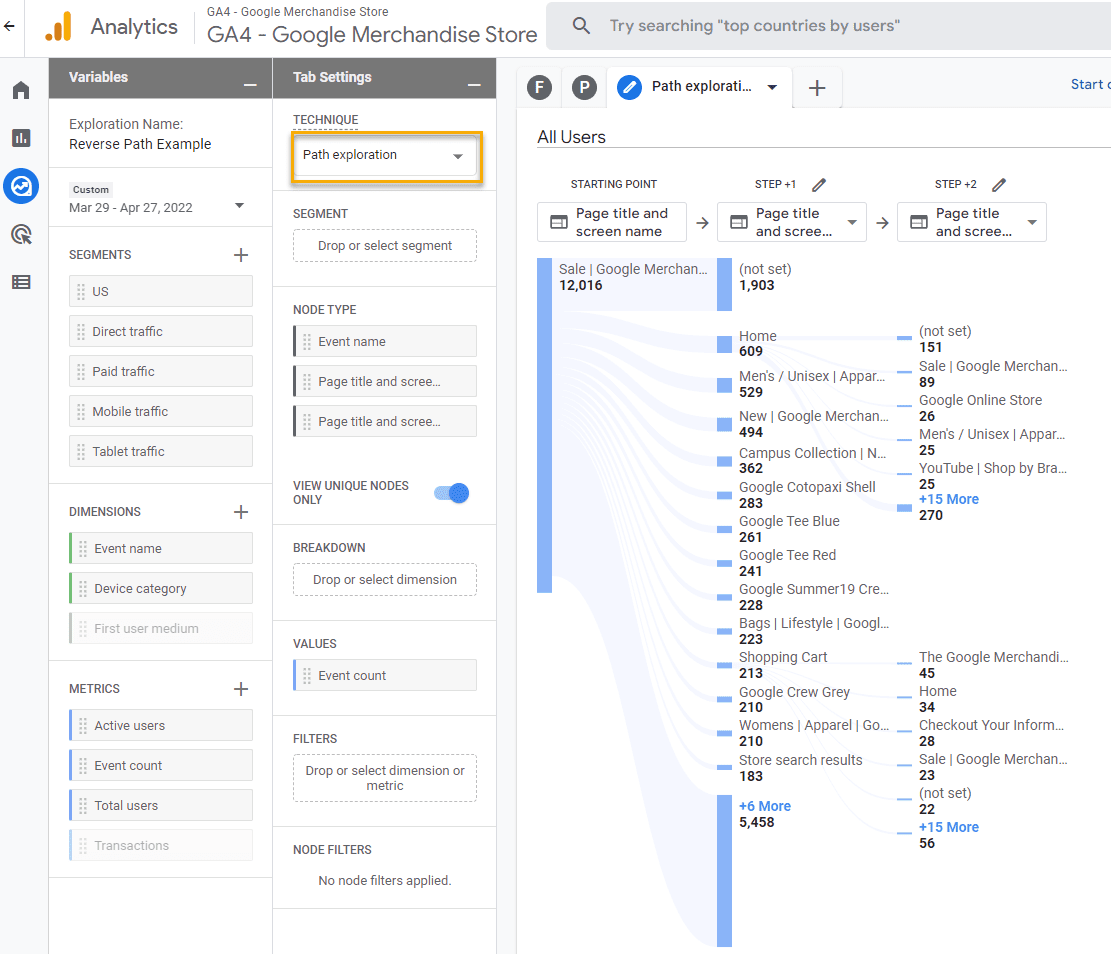
Another improvement that comes with the new GA4 interface is the ability to do path analysis of the user journey across your site. The new path exploration report is an advancement over what was available in Universal Analytics. Similar to funnels, this is an exploration report but using the technique “path exploration”. The steps can be based on “event name”, “page title and screen name” or “page title and screen class”. You can apply segments, filters and use several different metrics. Below is an example of looking at the page they visited after the Sale page and then the page after that from the Home or Shopping Cart page:.
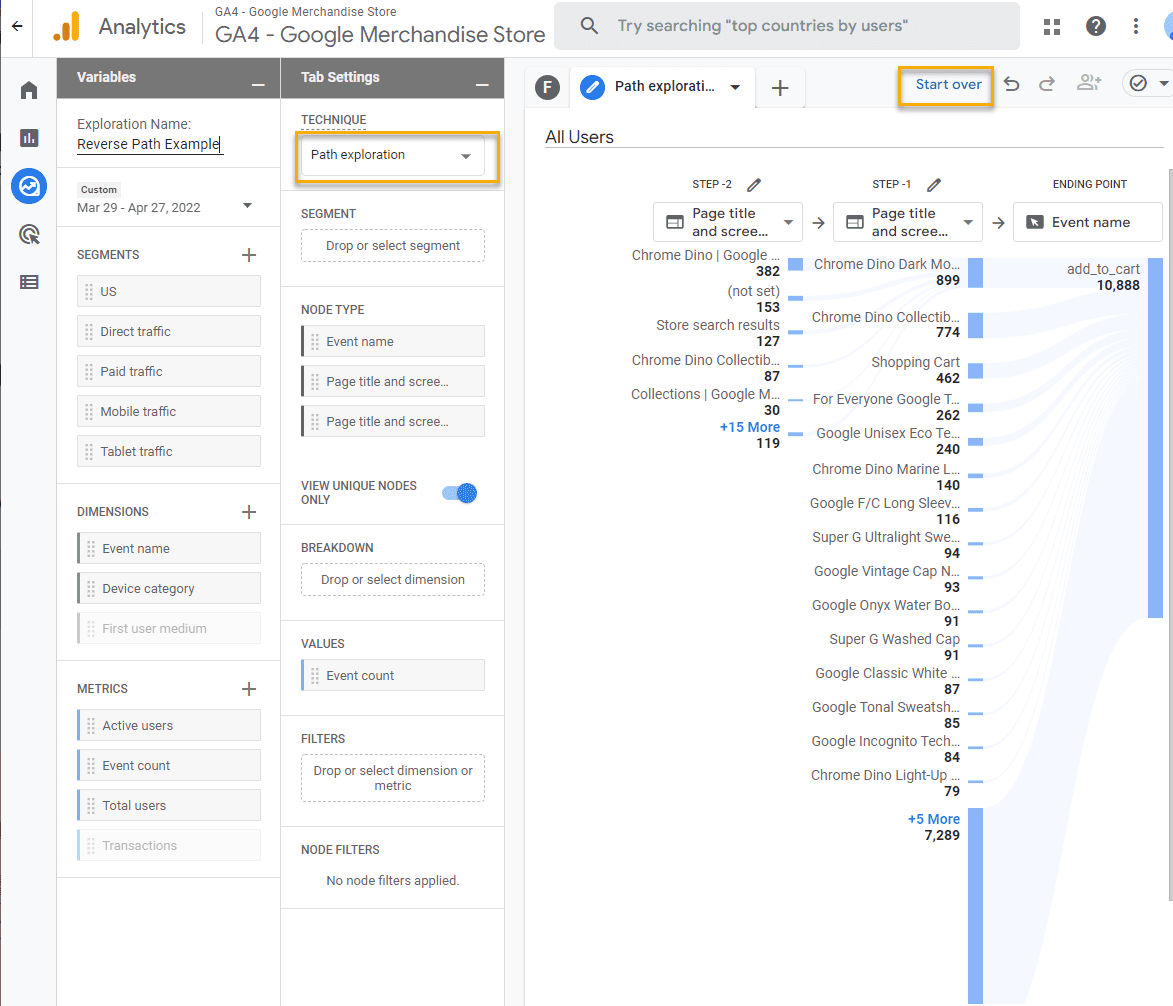
One of the more interesting features of the new pathing exploration is the ability to do reverse pathing. In essence you are able to choose a destination event or page and examine all the steps visitors took to get there. To access the reverse funnel, click “Start over” and select an endpoint for your analysis. The example below looks at the page where an add_to_cart event happened as well as the two pages before that. You can click on the items in the diagram to change the focus or see more items.
This can be especially helpful for tracking back a conversion or error event. For conversions, it can highlight paths that are most effective for leading to the conversion. If you start with an error event, you could track back the steps to troubleshoot the root cause and provide information to the development team to fix it.
While all of these new features represent steps towards a more useful analysis platform, additional refinement and options would be helpful. For instance, it is not possible to use a node based on a page path which is often superior to the page title. The presentation of the results also feels cramped especially when using a large monitor. That being said, we are looking forward to continued improvements of the GA4 platform in the coming months and years.