
Since the new year there have been some new initiatives that Hive Digital has begun to implement, as well as Google releasing some Google Analytics programs out of beta. Here is a quick run down:
- Cross-channel data-driven attribution
- Time-window metrics
- GA4 can Associated with GSC
- Measurement protocol
- More Google Ads data now available in Data Studio
Cross-channel data-driven attribution
Now you can attribute conversions via their Data-driven attribution which was previously exclusively on Google Analytics 360. This allows you to track different conversion cycles with longer conversion cycles in mind. Below is an example of a high level look of traffic converting on a website with different Mediums:
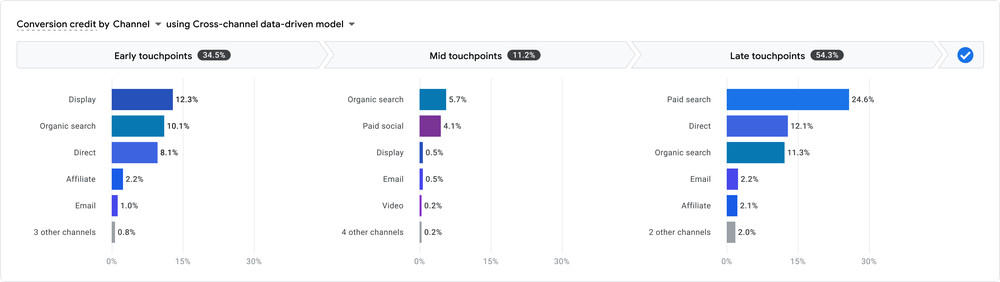
So we can mix and match different source/medium to allow us to get the most optimized “funnel” or attribution for the probability of traffic to convert.
DDA is an algorithm that looks at all of your website conversions. It takes into account each touch point that is observed. Then, it does some modeling to assign credit for each channel. In GA3, DDA looked at the last 4 touchpoints to do this modeling; in GA4, the number has increased significantly to 50+ touchpoints. This helps make sure that all of your marketing efforts are taken into account when assigning credit.
This program also allows you to select different models to attribute conversion as listed:
- Cross-channel last click: Ignores direct traffic and attributes 100% of the conversion value to the last channel that the customer clicked through (or engaged view through for YouTube) before converting. See examples below of how conversion value is allocated:
- Examples:
- Display > Social > Paid Search > Organic Search → 100% to Organic Search
- Display > Social > Paid Search > Email → 100% to Email
- Display > Social > Paid Search > Direct → 100% to Paid Search
- Note: This is the only last click model that you can export to Google Ads. Ads-preferred last click is only available for reporting purposes.
- First interaction model iconCross-channel first click: Gives all credit for the conversion to the first channel that a customer clicked (or engaged view through for YouTube) before converting.
- Linear model iconCross-channel linear: Distributes the credit for the conversion equally across all the channels a customer clicked (or engaged view through for YouTube) before converting.
- Time-decay model iconCross-channel position-based: Attributes 40% credit to the first and last interaction, and the remaining 20% credit is distributed evenly to the middle interactions.
- Position-based model iconCross-channel time decay: Gives more credit to the touchpoints that happened closer in time to the conversion. Credit is distributed using a 7-day half-life. In other words, a click 8 days before a conversion gets half as much credit as a click 1 day before a conversion.
*from Google
You can read more about this here.
Time-window metrics
A time window is a set amount of time that starts from the present moment and goes back in the past. Admins and Supervisors can use time windows to watch for spikes and unusual activity in metrics for Real-Time Operations. This will help them figure out when they need to reallocate resources.
The metrics used will only include data from Issues that were updated in the past window of time. For example, if the window of time is 30 days, then the average holding time for all Issues that received a first response from the assignee in the past 30 days will be calculated.
We can now do this in GA4 as shown in the picture below:
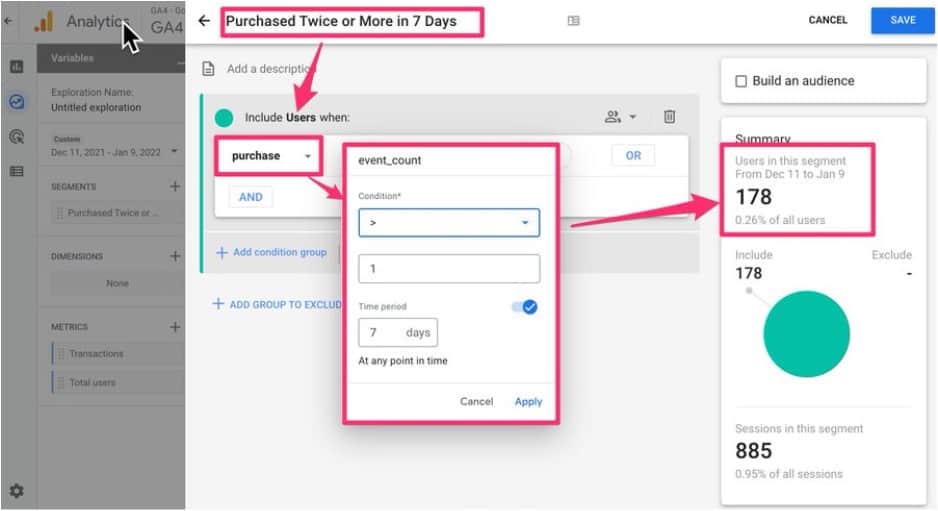
From user @CharlesFarina on Twitter
A couple of use cases:
- Who viewed 3+ videos in 5 consecutive days
- Who viewed 5+blog posts in 30 consecutive days
- Who purchased 2+ in 14 consecutive days
Using these time-window metrics will allow us to understand the behavior of traffic on the site so that we can better optimize or predict how they will convert on the site.
GA4 can now be associated with GSC
We can attach Universal Analytics (UA) to Google Search Console (GSC) data to get some insight as to how traffic behaves on the site. Now we can do the same thing on GA4. When linking GSC data to the site we can get some actionable insights as to how traffic is getting to the site via search queries and if this leads to a conversion.
Essentially, this is a great way to gain further insight has to do with how traffic interacts with your site and how you can adjust your content or efforts to increase conversions.
You can read more here.
Measurement protocol
From Google:
The Google Analytics Measurement Protocol for Google Analytics 4 allows developers to make HTTP requests to send events directly to Google Analytics servers. This allows developers to measure how users interact with their business from any HTTP-enabled environment. Notably, this makes it easy to measure interactions that happen server-to-server.
You can read more here.
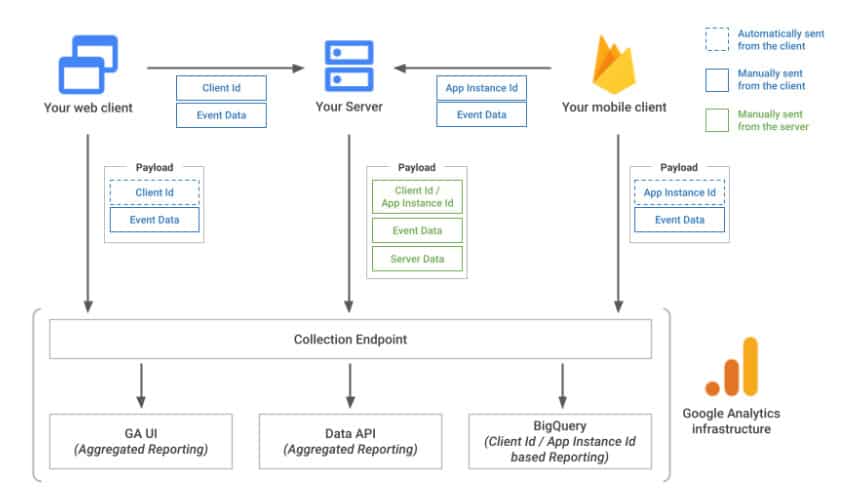
This feature set has moved from alpha to beta and is ready to be used in a limited capacity. Essentially, what we can now do is send custom events to GA4 using the measurement protocol to include data from sources like:
- CRM (Hubspot, Callrail, Salesforce)
- Credit card validation
Below is the process of how it’s collected:
More Google Ads data now available in Data Studio
Getting data into Google Data Studio from Google Ads has had limited functionality. Google recently updated what other data can be now be accessed in Google Data studio.
You can now visualize the following dimensions using the Ads connector:
- Account Budget Order Amount
- Account Budget Order Adjustable Amount
- Account Budget Amount Spent
- Campaign Bid Strategy Type
- Ad Group Bid Strategy
- Target CPA
- Target ROAS
- User Ad Distance
- First Position Bid
*From Google
You can read more here.