
Google has recently enabled the ability to create custom funnel reports in GA4 allowing you to visualize and evaluate the customer journey while on your site. By determining relevant steps in the desired task process you can now better determine when users drop off between each step.
But first things first…
What is a funnel report?
A funnel report allows you to visualize the steps users take towards a specific goal conversion. The report provides insights into the user journey allowing you to highlight the drop-off rates at each step and identify potential areas of improvement in the desired conversion process.
The funnel report consists of a predefined series of steps that users are expected to follow, starting with the initial interaction and progressing through subsequent stages until reaching the desired outcome. Each step in the funnel represents a specific action or event that users must complete to move forward.
Why are funnel reports important?
The primary purpose of a funnel report is to analyze the conversion funnel and identify any bottlenecks or points of friction that lead to drop-offs or incomplete conversions. By visualizing the conversion path and observing user behavior at each step, businesses can pinpoint areas where users are abandoning the process and take steps to optimize those stages to improve overall conversion rates.
How are funnel reports created in GA4?
Funnels can be created based on various user interactions, such as form submissions, checkout processes, or specific actions that indicate progress towards a conversion goal. Custom funnel reports allow businesses to define their own steps and track the conversion flow that aligns with their specific objectives.
You can learn more about setting up funnels in GA4 here. But to summarize:
- Start by clicking the Explore navigation link on the left side of the GA4 home screen.
- Then click on Funnel exploration
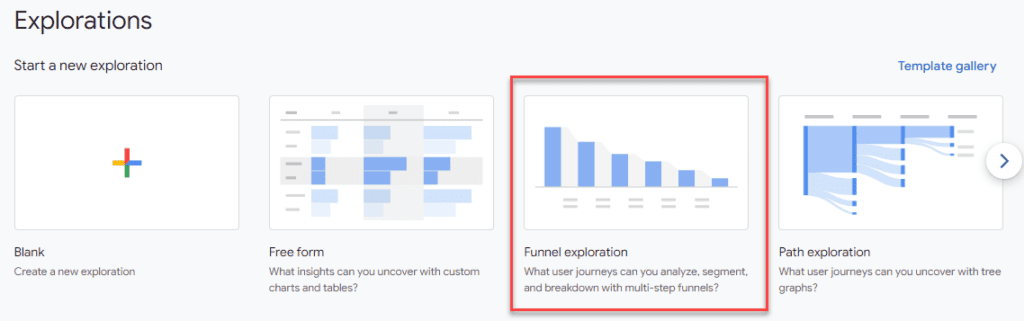
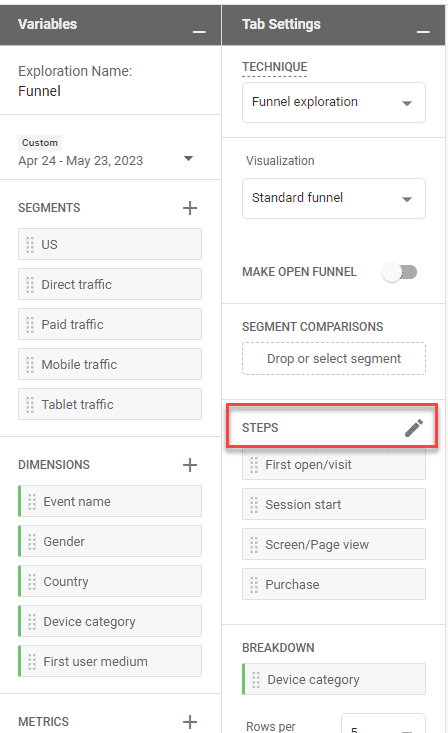
- You’ll notice a default report with a 3 step funnel exploration including steps from First open/visit to Purchase. You’ll want to edit these steps to include the funnel you are wishing to explore. This is usually the process of steps it takes to fill out a form or purchase an item.
- On the left there will be a panel with several tiles allowing you to customize the report. Click on the pencil in the Steps tile to edit.
- From here you will be able to name and select from a variety of options for each of the steps in the funnel you want to explore. For instance if you would like to add a certain page/screen as the first step in the funnel you would select “page_view” and add a custom parameter of “page_location” with the condition of exactly matches “contact-us-form-step-1” (if that is the url of the page. You would then repeat this for the remainder of steps it take to reach the desired goal.
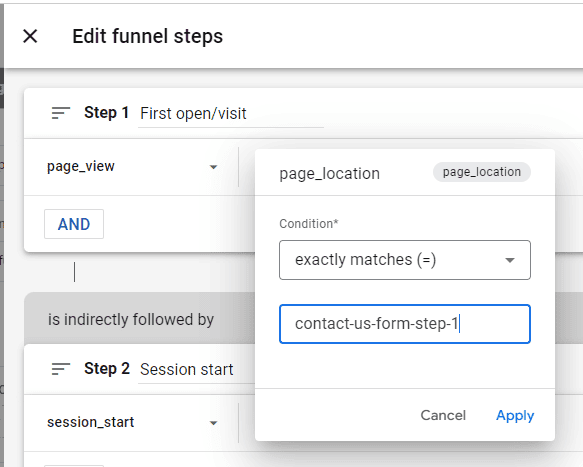
- The final step you create should be the goal/success/purchase page url (in this case) of the funnel.
So now what? Key statistics to examine.
Once you set these steps, there are several key statistics that can provide insights into the performance of each step and the overall conversion rate. Here are some common statistics related to funnels:
Step Completion Rate – The percentage of users who successfully complete each step of the funnel compared to the total number of users who entered the funnel.This can help you spot steps with high or low completion rates revealing potential points of friction or drop-offs.
Funnel Conversion Rate – The percentage of users who completed the entire funnel journey and achieved the desired conversion or goal. You can obtain this by multiplying the completion rates of all the steps in the funnel. This will give you an idea of the overall effectiveness of the conversion process.
Abandonment Rate – The percentage of users who exit the funnel at a specific step without completing it. This can reveal the stages where users are dropping off the most, bringing to light potential issues or barriers to completion.
Step-to-Step Conversion Rate – The percentage of users who progress from one step to the next in the funnel. This shows where users are most likely to continue or abandon the conversion process.
Time Spent in Funnel – The average time users spend within the funnel, indicating the overall engagement and level of user interest. Longer durations may suggest higher engagement, while shorter durations may indicate user impatience or lack of interest.
Funnel Leakage Points – These are steps in the funnel where a significant drop-off occurs compared to the previous step. Identifying leakage points helps prioritize areas for optimization and conversion rate improvement.
Goal Completion Rate – The percentage of users who successfully complete the final conversion or goal of the funnel. It directly measures the effectiveness of the entire conversion process. The average goal completion rates can vary widely across industries and even within different sectors of the same industry. Factors such as the complexity of the conversion process, the target audience, the type of goods or services being sold, and the overall user experience can all impact goal completion rates
Things you can do to help improve your funnels!
Here are some areas you can focus on to help reduce friction in the conversion process:
Streamline the User Flow – Simplify the steps users need to take to complete the conversion. Remove any unnecessary or redundant steps and make the process as straightforward as possible. Minimize form fields, reduce the number of clicks required, and optimize the navigation flow.
Optimize Website Speed – Ensure your website or app loads quickly and performs smoothly. Slow loading times can frustrate users and lead to high bounce rates. Optimize images, leverage caching, and employ content delivery networks (CDNs) to enhance website speed.
Improve Mobile Experience – With the rise of mobile usage, it’s essential to optimize your website or app for mobile devices. Implement responsive design, ensure mobile-friendly navigation, and simplify forms and checkout processes for mobile users.
Provide Clear and Concise Information – Make sure your product or service information is easily accessible and clearly presented. Use concise and compelling copywriting, highlight key features and benefits, and address common user questions or concerns.
Simplify Forms – Lengthy or complicated forms can discourage users from completing conversions. Only ask for essential information, use autofill features when possible, and consider implementing alternative form options like social login or guest checkout.
Display Trust Indicators – Build trust with your audience by prominently displaying trust signals such as customer reviews, security badges, guarantees, or certifications. Clear privacy policies and secure payment options can also alleviate concerns and increase confidence in the conversion process.
Offer Guest Checkout – Requiring users to create an account can create friction. Provide an option for guest checkout to allow users to complete their purchase without the need for registration. Offer the option to create an account after the conversion is complete to encourage future engagement.
Implement Progress Indicators – When the conversion process involves multiple steps, use progress indicators to clearly show users where they are in the process and how much is left. This reduces uncertainty, provides a sense of progress, and encourages users to continue.
Optimize Call-to-Action (CTA) Buttons – Use clear and compelling CTAs that guide users to the next step in the conversion process. Make sure buttons are visually distinct, use action-oriented language, and place them prominently on the page.
Conduct User Testing and Feedback – Continuously gather user feedback and conduct usability testing to identify pain points and areas of friction in the conversion process. Understand user behavior and preferences to make informed optimizations.