Over the last few weeks, many of you may have suffered through boring tweets coming from me regarding my new shiny toy, the Open Penguin Data project. For those of you who have been lucky enough to ignore the mindless updates, here is the gist.
My goal is simple and straightforward: build a model that reasonably approximates the risk of Penguin penalty
I have collected and audited a number of URL/Keyword pairs that were impacted by Penguin 2.0, along with their competitors who were unaffected in the update. This data has been provided at the Open Penguin Data website. In addition, I have been toiling away at building unique metrics which Google may be using in order to flag websites with manipulative link profiles. Yes, I know, most SEOs can spot one from a mile away, but teaching a computer to do it at scale is far more difficult.
I have toyed with variables ranging from link velocity and link types to anchor text commercial value and citation flow. While the list keeps growing, I wanted to share with you all some preliminary results.
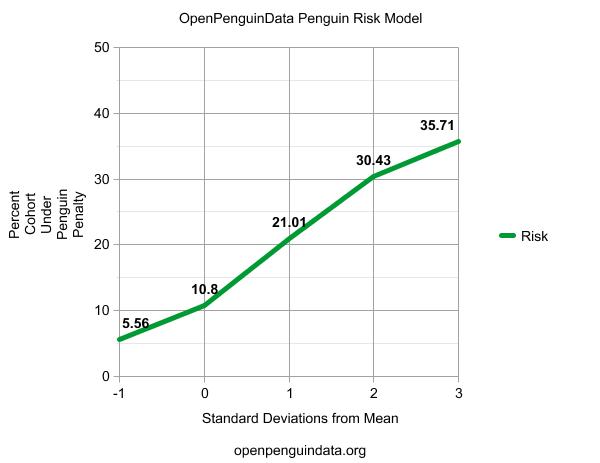
This is exciting stuff. We scored each URL/keyword pair using all of the variables we have acquired and then lumped them together based on their resulting risk score. The average URL/Keyword pair in our data set had a 10% chance of being penalized. (This makes sense, as for every URL/Keyword pair that was penalized we collected the other 9 competitors in the top 10 that weren’t hit). However, if we only look at URL/Keyword pairs that scored 1 standard deviation below the mean using our model, only 5.56% were penalized. However, if we look at URL/Keyword pairs that scored 1 standard deviation above the mean (indicating they were using some riskier tactics), the chance of being penalized nearly doubled! And as we keep going up in risk score, the sites we tracked were more and more likely to be penalized.
We are just getting started here. This is actually a fairly crude model based on a few hours of programming. We should expect to get better and better results. If you want to participate, feel free to provide your own recommended variables which we can include in the analysis!
Happy Penguin Hunting!